Workforce
Wayne County has more commuters that come to Wayne County to work than leave the county to work making Wayne County our region’s employment center. The region identified in the table below puts Wayne County geographically in the center of our neighboring counties, however, more details on our labor shed can be found below that demonstrates our regional labor shed is much larger.
| Data | Wayne County Region | Wayne County | Indianapolis | Dayton | Cincinnati | Indiana | Ohio | United States |
| Per Capita Personal Income | $28,921* | $29,848 | $66,500 | $41,443 | $37,280 | $35,578 | $37,729 | $41,261 |
| Median Household Income | $54,660 | $54,854 | $62,776 | $25,357 | $49,191 | $66,768 | $66,990 | $75,149 |
| Feb 2024 Unemployment Rate | 4.6% | 4.6% | 3.5% | 3.7% | 4.2% | 3.5% | 3.7% | 3.9% |
| Union Membership | N/A | 3.6% | N/A | N/A | N/A | 8% | 12.5% | 10% |
| Labor Force | 107,635 | 19,081 | 303,110 | 142,619 | 104,941 | 2,119,803 | 3,683,452 | 106,380,520 |
*represented as an average of the following counties: Darke (OH), Fayette, Henry, Preble (OH), Randolph, Union, and Wayne
Sources: Stats Indiana – 2022 Wayne County Profile; U.S. Bureau of Labor Statistics; Union Membership & Coverage Database – 2023 data; U.S. Census Bureau – Quick Facts
2024 Wage and Benefit Survey
Survey of East Central Indiana Companies
Wayne County, Indiana Employee Child Care Survey
The EDC of Wayne County collaborated with Forward Wayne County and the Purdue Center for Regional Development to conduct a survey regarding child care for working parents.
Wayne County Employee Child Care Survey
Labor Market Overview
This includes detailed commuter data and Wayne County’s labor shed from a 15, 30, 45, and 60 mile radius.
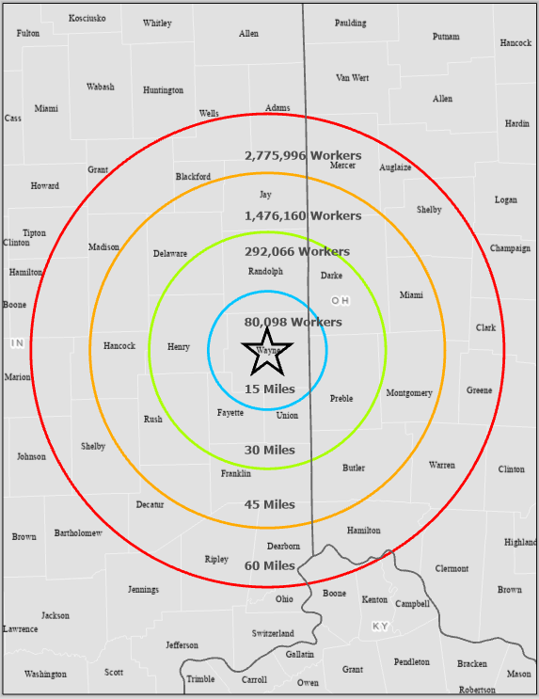
Source: Purdue Center for Regional Development
Recent Expansions and Layoffs/Closures
Recent expansions (last 5 years)
| Company | Year | # Jobs | Industry |
|---|---|---|---|
| Richmond Beverage Solutions | 2024 | 65 | Dairy Processor |
| Transcendia | 2024 | 30 | Extruded Plastics Manufacturer |
| Blue Buffalo | 2023 | 50 | Pet Food Manufacturer |
| Menasha | 2023 | 321 | Packaging Company |
| Supply Source | 2023 | 49 | Global Cleaning & Safety Supplier |
| Anchor Ingredients | 2023 | 30 | Pet Food Ingredient Supplier |
| Liberation Labs | 2023 | 45 | Precision Fermentation |
| Dot Foods Transportation | 2022 | 43 | Food Redistributor |
| Johns Manville | 2022 | 2 | Insulation |
| Richmond Baking Company | 2022 | 38 | Food Manufacturer |
| Taconic Bioscience | 2022 | 18 | Prod. of Laboratory Mice & Rats |
| Vandor Group | 2022 | 28 | Funeral Prods & Auto Inj. Molding |
| ITD Engineering | 2021 | 6 | Fabrication and Welding |
| Phillips Tube Group | 2020 | 30 | Welded Steel Tube Manufacturer |
| Element 13 | 2020 | 30 | Aluminum Billet Manufacturer |
Recent Layoffs/Closures (last 5 years)
| Company | Year | # Jobs | Industry |
|---|---|---|---|
| TBK | 2024 | 86 | Oil & Water truck pumps |
| Champion Target | 2024 | 16 | Clay Target Manufacturer |
| JMC Distribution | 2020 | 12 | Warehouse and Distribution |
| Mosey Manufacturing | 2020 | 230 | Auto-Component Manufacturing |
| Qualitronics | 2020 | 30 | Wire Harness Manufacturing |
Wayne County Annual Industry Distribution of Jobs and Average Wages – 2022
| Industry | Establishments | Jobs | % Dist. | Wage Per Job |
| Total | 1,444 | 29,362 | 100% | $46,443 |
| Agriculture, Forestry, Fishing, & Hunting | 14 | 125 | 0.40% | $48,314 |
| Mining | 2 | 20 | 0.06% | $69,176 |
| Utilities | 6 | 167 | 0.60% | $75,159 |
| Construction | 114 | 872 | 2.96% | $47,187 |
| Manufacturing | 109 | 5,733 | 19.53% | $56,733 |
| Wholesale Trade | 80 | 691 | 2.40% | $62,456 |
| Retail Trade | 234 | 3,542 | 12.6% | $32,261 |
| Transportation & Warehousing | 56 | 872 | 3.00% | $59,050 |
| Information | 22 | 229 | 0.78% | $39,247 |
| Finance & Insurance | 95 | 788 | 2.68% | $62,770 |
| Real Estate, Rental, & Leasing | 52 | 156 | 0.53% | $38,306 |
| Professional, Scientific, and Technical Services | 103 | 470 | 1.60% | $58,114 |
| Management of Companies and Enterprises | 9 | 305 | 1.03% | $85,982 |
| Admin. & Support & Waste Mgt. & Rem. Services | 79 | 1,385 | 4.70% | $33,900 |
| Educational Services | 23 | 2,900 | 9.87% | $36,838 |
| Health Care and Social Services | 148 | 6,316 | 21.51% | $58,286 |
| Arts, Entertainment, and Recreation | 23 | 186 | 0.63% | $21,758 |
| Accommodation and Food Services | 144 | 2,874 | 9.78% | $18,861 |
| Other Services (Except Public Administration) | 102 | 703 | 2.39% | $30,686 |
| Public Administration | 31 | 1,027 | 3.49% | $47,096 |
Source: JobsEQ, 2022
Right-To-Work
A right-to-work law is a statute in the United States of America that prohibits union security agreements, or agreements between labor unions and employers that govern the extent to which an established union can require employees’ membership, payment of union dues, or fees as a condition of employment, either before or after hiring. “Right-to-work” laws do not, as the short phrase might suggest, aim to provide a general guarantee of employment to people seeking work, but rather are a government regulation of the contractual agreements between employers and labor unions that prevents them from excluding non-union workers, or requiring employees to pay a fee to unions that have negotiated the labor contract the workers work under.